The impact of rising global atmospheric temperatures is now visible in the increased land and ocean temperatures, sea-level rise, melting of glaciers, and more frequent and more extreme weather and climate events such as extreme heat, extreme precipitation, drought, and flooding. Such extreme events cause billion-dollar losses each year only in the U.S. Therefore, there has been a growing demand for actionable climate science research that helps stakeholders (e.g., nations, city planners, water managers) make both real-time and long-term decisions based upon reliable projections/ predictions of extreme events on timescales from days to several years. However, several factors exacerbate the difficulty of this work, such as the highly uncertain nature of day-to-day weather, inadequate knowledge of the underlying physics, lack of observational data, imperfect climate models, and limited computing power. I work broadly in the area of weather and climate extremes (e.g., rainfall and temperature extremes). More specifically, my research focuses on the processes that lead to extreme rainfall and temperature events, detection and attribution of climate change, decadal predictability, future climate projections, estimation of future intensity, duration, frequency (IDF) curves of precipitation, climate model evaluation, and co-production of actionable climate science. My research can be broadly divided into the following categories.
Global and Regional Climate Model Evaluation
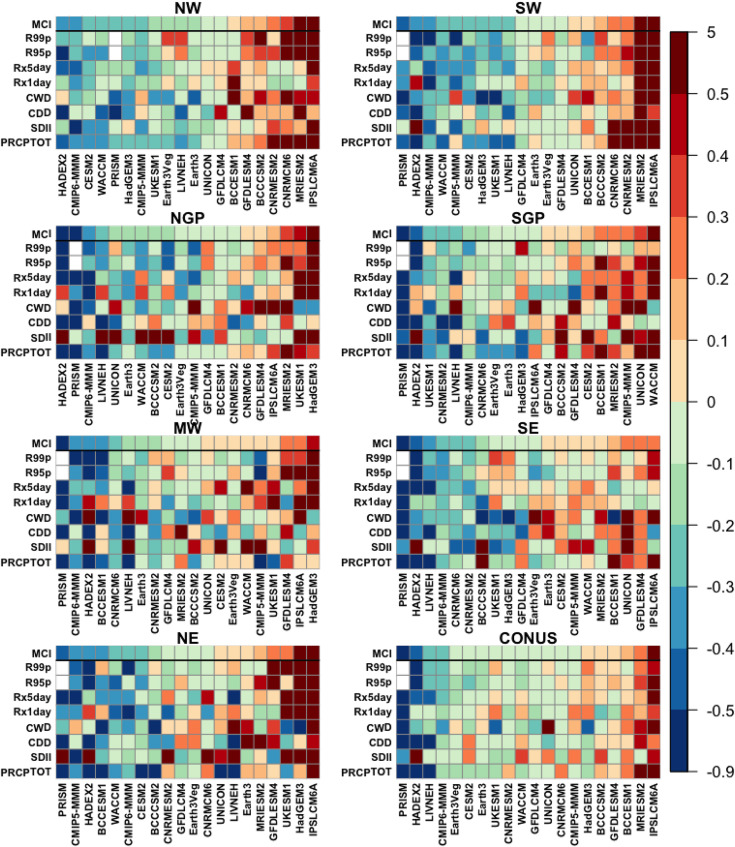
While climate models generally predict an increase in the global mean precipitation in response to a human-caused increase in greenhouse gases, their response is much more uncertain on local to regional scales. However, the projections of precipitation have significant uncertainty because of insufficient observational data, lack of complete knowledge of precipitation-related physical mechanisms, imperfect regional climate models, etc. In a series of publications, I have analyzed precipitation and its mean and extreme ETCCDI indices in recently available global and regional climate models. My analysis suggests that the models have made some progress in simulating precipitation quantities, but their performance varies spatially and temporally.
Reduction of uncertainty in intensity, duration and frequency (IDF) curves of precipitation
Traditional multimodel methods for estimating future changes in precipitation intensity, duration, and frequency (IDF) curves rely on the mean or median of models’ IDF estimates. However, such multimodel estimates are impaired by large estimation uncertainty due to the small sample size. My research shows that pooling model data can reduce bias and uncertainty in IDF estimates.
Changes in 24-h precipitation (mm/day) for 50-yr return periods in the Susquehanna watershed. Differences significant at the 5% significance level are shown as solid squares and those not significant at 5% are shown as blank circles. (published in 2021 in Journal of Hydrometeorology).
Detection and attribution, and Future climate Projections
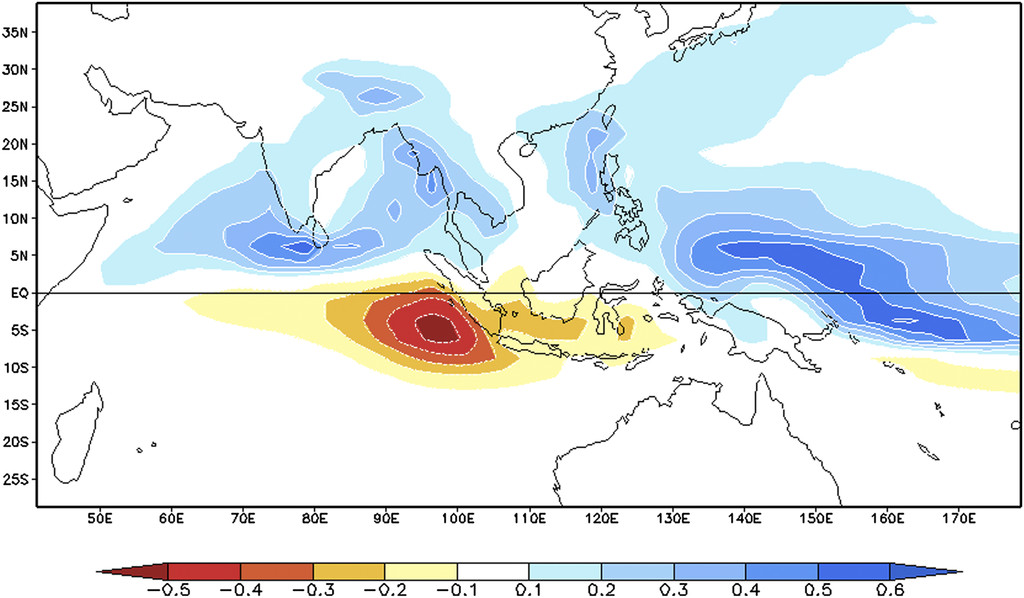
Reliable future climate projections are challenging because of the small signal-to-noise ratio (SNR), attributed to large internal variability and lack of fine-resolution climate information. Inspired by these limitations, my research involves (i) the application of sophisticated statistical techniques that can maximize SNR and thus detect robust patterns of future changes in climate, and (ii) the use of state-of-the-art, cutting-edge regional climate models that can refine information at regional scales.
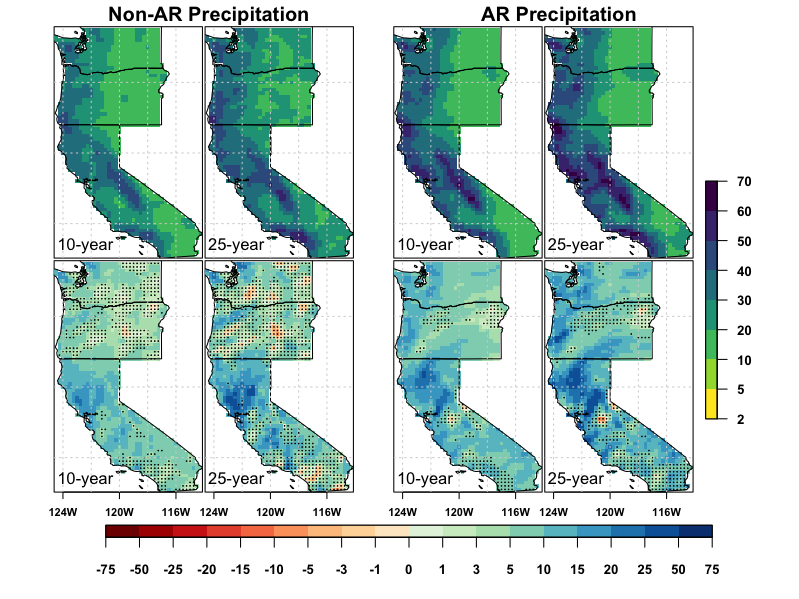
Left panel: Both the non-AR and Ar precipitation over the western US states will increase in future as projected in the variable-resolution (published in 2020 in Geophysical Research Letters). Right panel: The most detectable climate change pattern of JJAS mean South Asian summer monsoon precipitation (mm/day per unit variate) derived from 23 CMIP5 models for the twenty-first-century (RCP8.5) runs. (published in Journal of Climate).
Co-production of climate science
Co-production is the principal mechanism through which stakeholders and scientists engage in a meaningful way to produce actionable and decision-relevant climate science. The critical goals of the co-production are to invent stakeholder-relevant metrics for climate model evaluation and develop tools/ methods for effective communication between climate scientists and stakeholders. My research involves the innovative use of metrics for climate model evaluation.
The Schematic diagram shows the use of metrics as essential tools for developing decision-relevant science through cyclic stakeholder-scientist engagement. (published in 2022 in WIREs Climate Change).
Decadal predictability
Sources of decadal predictability often are divided into two kinds: predictability caused by external forcing, such as changes in solar insolation, volcanic aerosols, and anthropogenic greenhouse gases, and predictability due to internal variability arising naturally from the coupled atmosphere–ocean–land–ice climate system. The precise mechanisms for this decadal predictability are not clear, although the dynamics of ocean circulation are widely believed to play a major role. My research shows that the most predictable components on decadal timescales in climate models with or without interactive ocean dynamics are similar. This suggests that ocean circulation may not be a dominant source of decadal predictability.
Most predictable component in coupled and slab models. Most predictable component is derived by maximizing the average predictability time (APT) separately in coupled and slab models (published in 2017 in PNAS).